Fundamental Analysis of Nifty 500 Stocks: Key Performance Indicators (Revenue, Net Profit, EPS)
*Fully Automated Process Using Python and Power BI*
1. Web Scraping of Fundamental Data:
Fundamental data for all Nifty 500 stocks has been collected through automated web scraping using Python.
2. Statistical and Quantitative Analysis:
Key performance indicators such as Revenue, Net Profit, and EPS have been analyzed using Python to identify statistical patterns and trends.
3. Trend Visualization in Power BI:
KPI trends for all stocks have been dynamically visualized in Power BI dashboards for better understanding and insights.
4. Automated Stock Screening:
A fully automated process integrates Python and Power BI to identify fundamentally strong stocks efficiently.
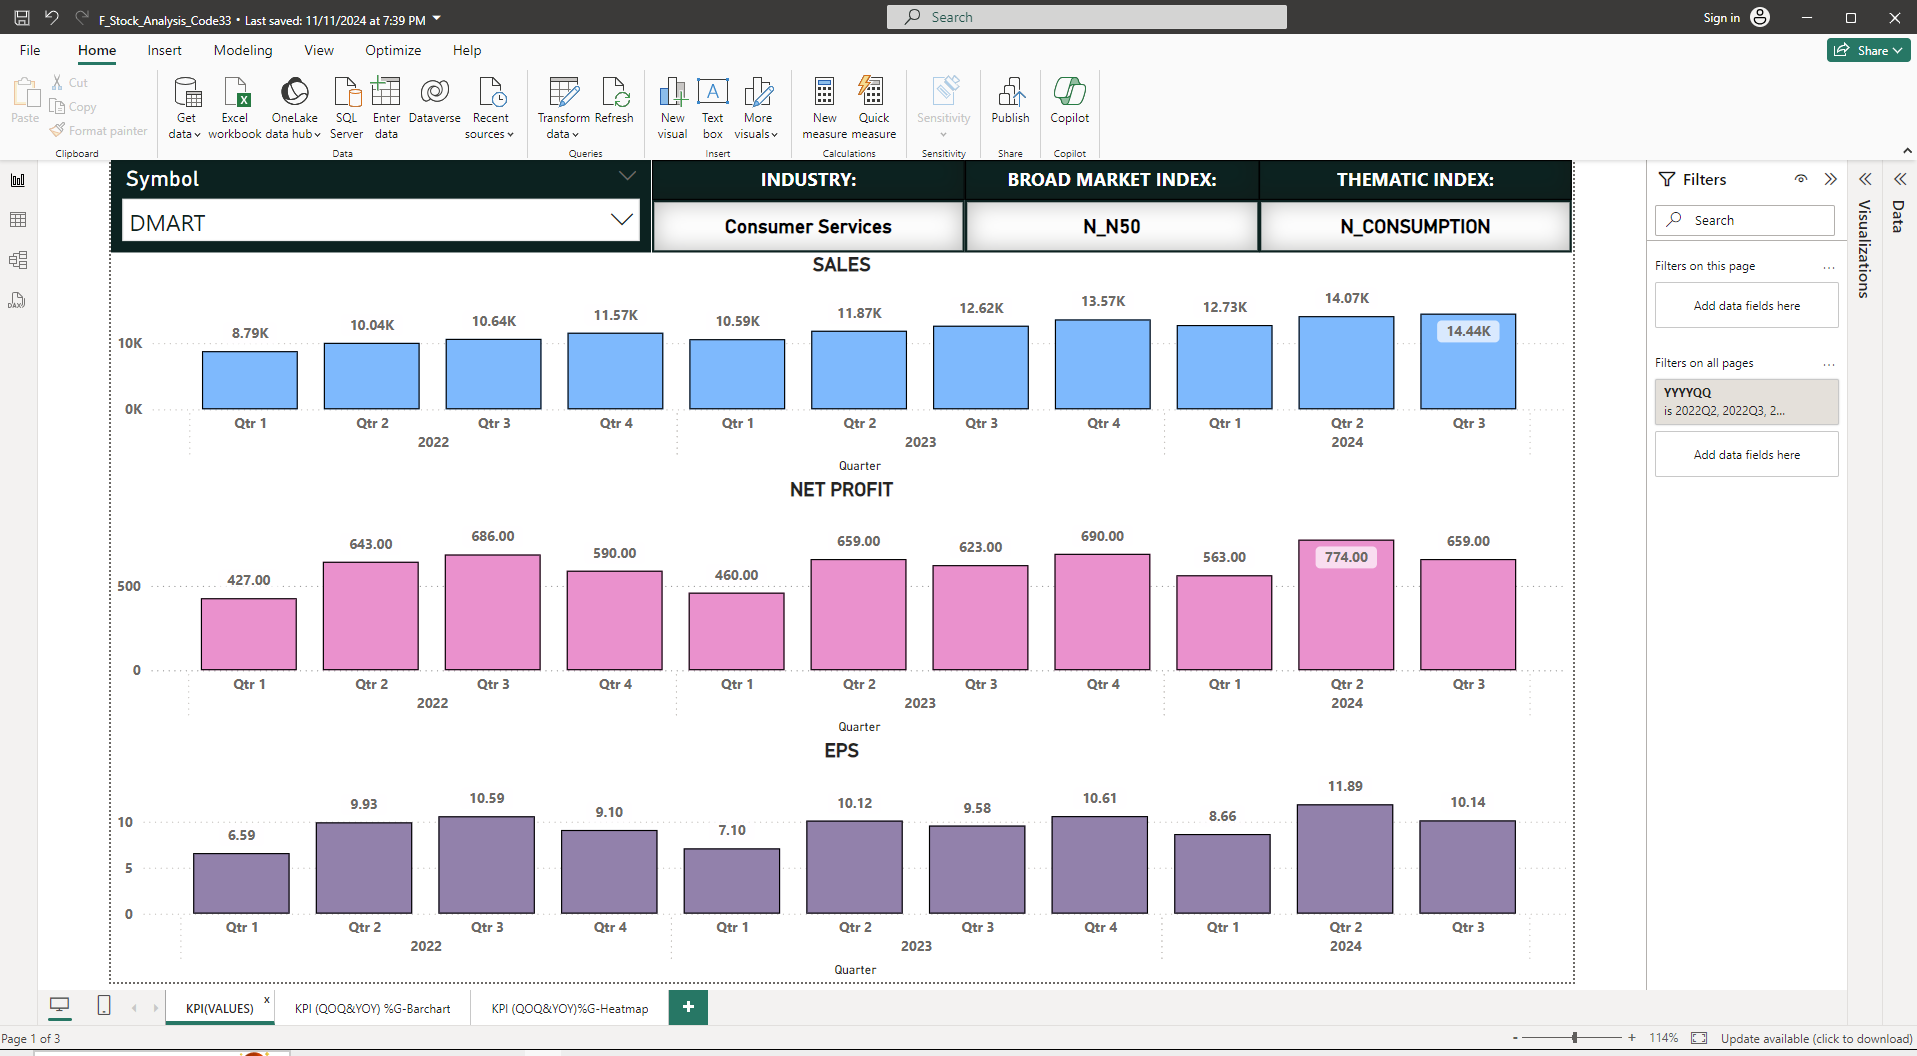
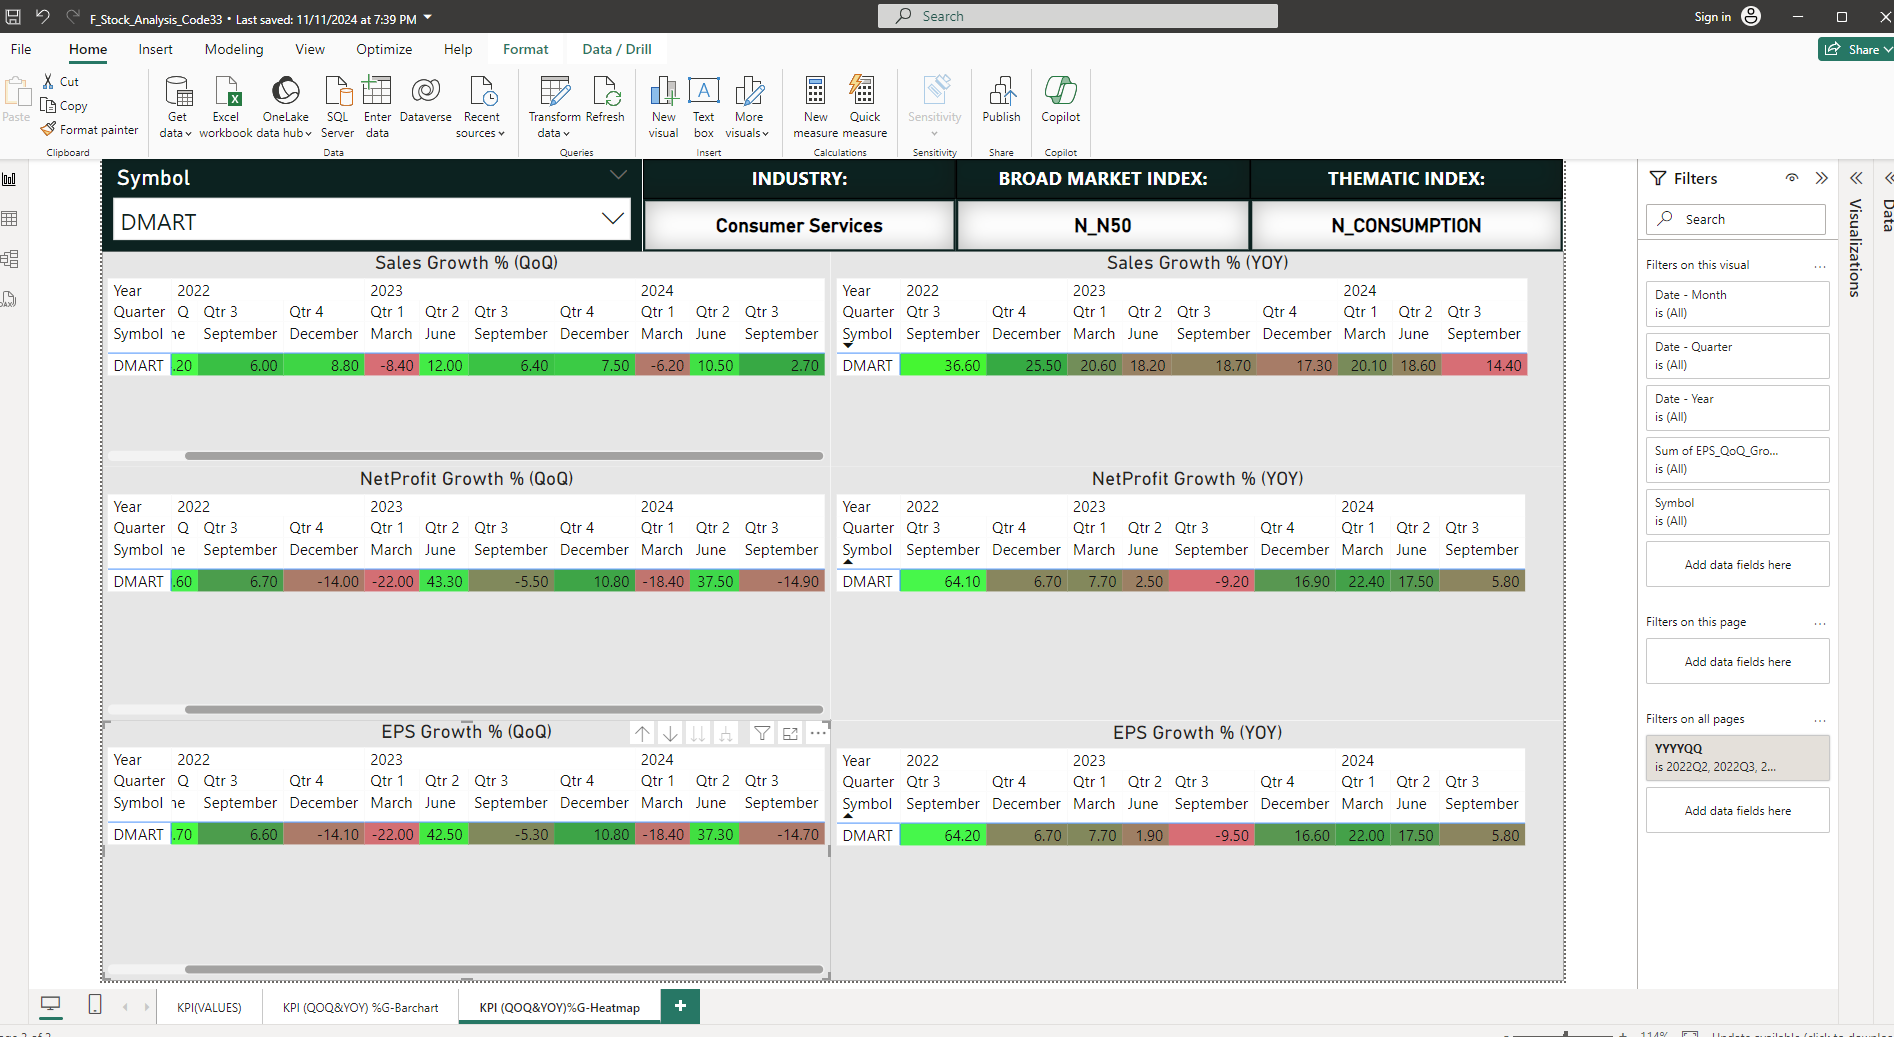
Stocks Quarterly Sales, Net Profit and EPS Trend
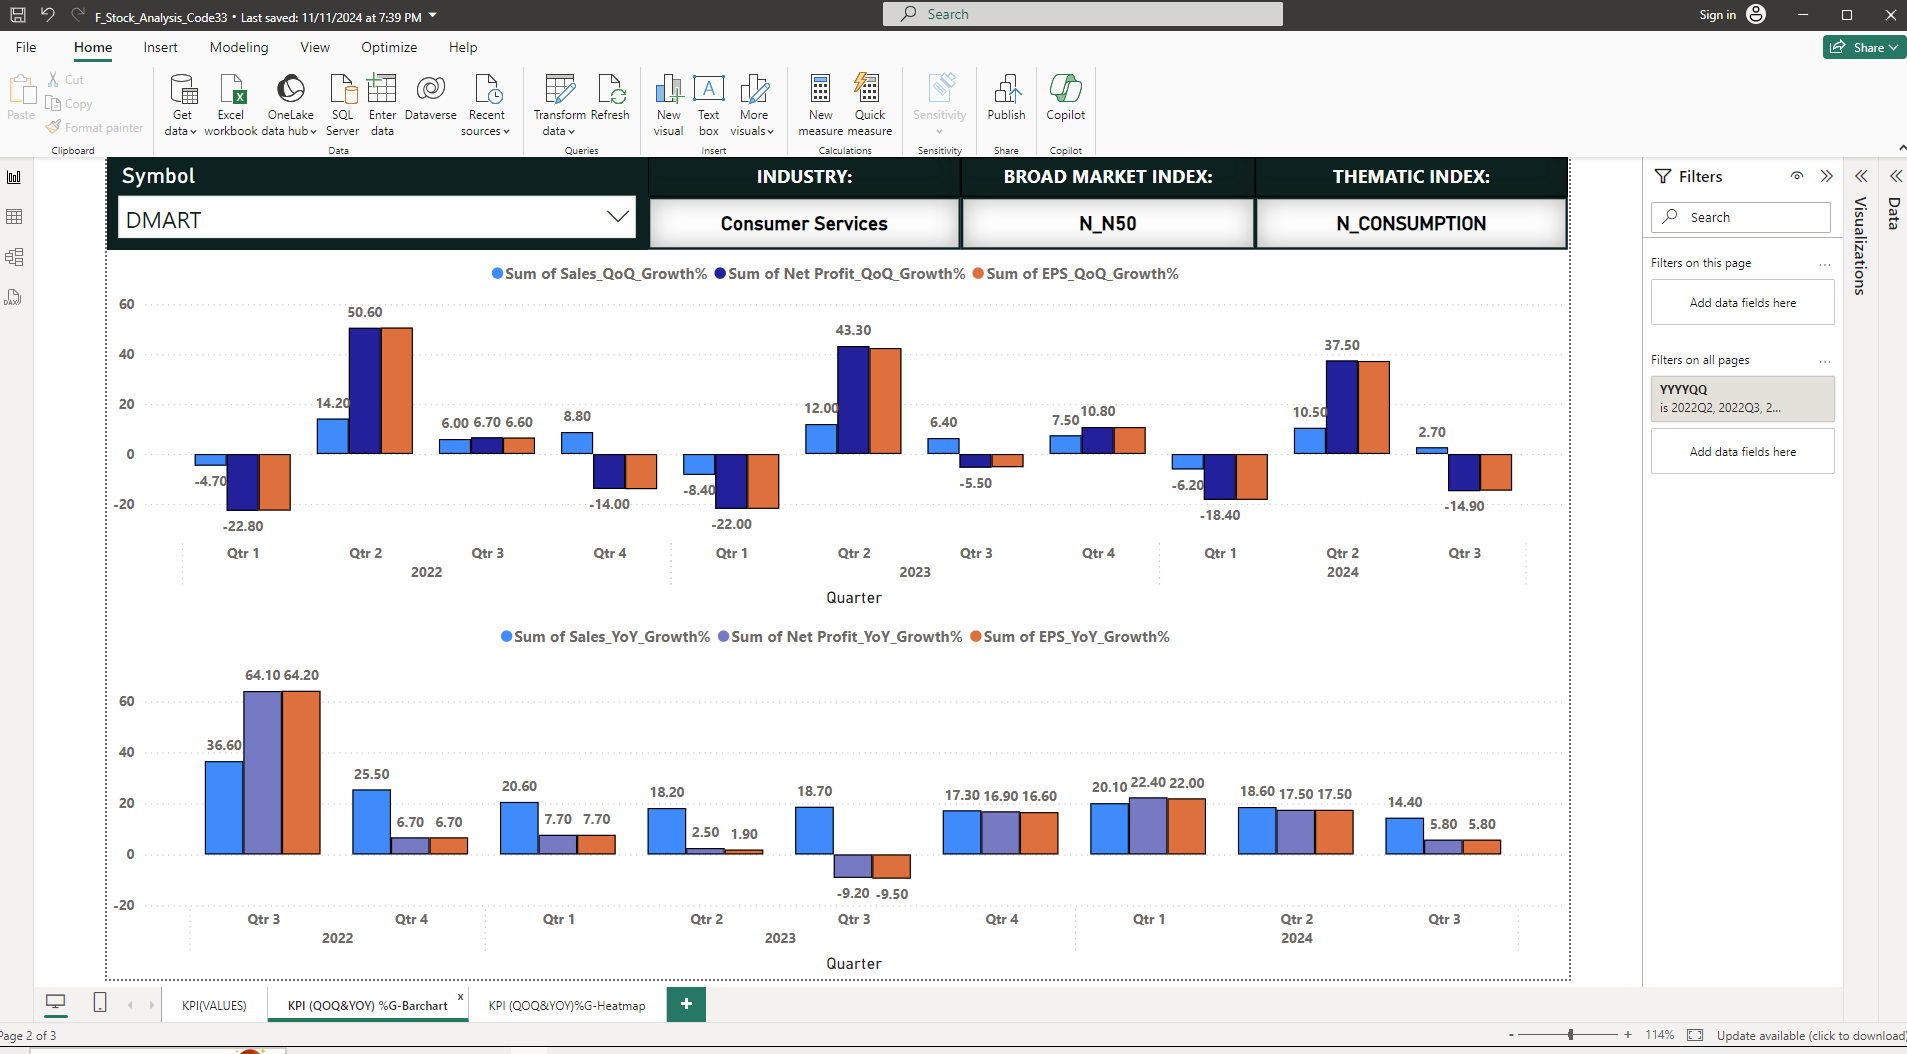
QOQ % Growth and YOY % Growth of Major KPI